Pouch-Cell Test Case: Capacity, Rate Capability, Cold Tests and Evidence Limits
Review a third-party case involving two approximately 5.2 Ah pouch cells: recalculate rate-capacity ratios and examine cold, cycling, nail-penetration and SEM/EDS results with their limitations.
October 19, 2026Green Battery Editorial TeamAbout 12 min read
Green Battery Insights
Evaluate pouch-cell performance across five tests
Nominal capacity alone cannot describe pouch-cell performance. Discharge rate, cold-temperature voltage, capacity retention and safety response each affect suitability, while materials analysis provides additional context. This article examines third-party test records for two approximately 5.2 Ah pouch cells, reviewing capacity, rate capability, cold tests, cycling and nail penetration, and independently checking key ratios. The model, batch, complete raw data and some test conditions were not disclosed, so conclusions apply only to this sample set and are not Green Battery product specifications.
The sections below distinguish test conditions, reported measurements and independent calculations. The summary graphic redraws the disclosed discrete values; it is neither a new experiment nor a raw continuous curve. The rate curve, nail-test photograph and materials images document this third-party case.
Summary reformatted from reported numbers; not a raw continuous curve or new measurements.
1. Establish the object and test conditions
The report gives 4.2 V charge cutoff and 2.75 V discharge cutoff. Capacity, cold and parts of the safety work are described at 1C and cycling at 3C. Rated capacity used to define C-rate, room temperature, rests, fixture pressure, cooling and instrument accuracy are incompletely disclosed, so the exact current and protocol cannot be reconstructed.
Sample #1 is reported as 118 × 40 × 10 mm, initially 3.812 V and 1.7 mΩ. The resistance method, SOC and temperature are absent; do not relabel it as comparable DCIR. Link dimensions, mass, voltage and resistance to the same sample record.
2. Capacity and specific energy
In the capacity test, #1 delivered 5178.6 mAh at 1C, with midpoint voltage 3.7906 V and constant-current charge fraction 91.41%; #2 gave 5215.0 mAh, 3.7868 V and 91.87%. The 36.4 mAh difference is about 0.70% of their mean. Two close results do not establish a production distribution or matching consistency.
The report also states 118.39 g and 166.80 Wh/kg without clearly linking mass to a sample or providing integrated Wh. Verify E = ∫V I dt and E/mass. Midpoint voltage multiplied by capacity is only an approximate check, not an energy integral.
3. Check the denominator of capacity retention
For #2, reported discharge capacities are 5243.6 mAh at 0.5C, 5220.8 at 1C, 5220.9 at 3C and 5222.4 at 5C. Constant-current charge fractions are listed as 95.57%, 88.56% and 84.05% at 1C, 3C and 5C; no swelling was reported after 5C discharge. Keep these rate tests separate from the preceding capacity test.
The text labels 99.60% as 5C/1C. However, 5222.4/5220.8 ≈ 100.03%, while 5222.4/5243.6 ≈ 99.60%. The reported percentage therefore fits a 0.5C reference. A result slightly above 100% is not proof of extra capacity generated by high rate: repeatability, temperature, sequence and resolution may contribute. Also assess Wh, loaded voltage, temperature and repeat samples. No visible swelling alone is not a complete safety result.
Reported rate charge/discharge curves; point-by-point data is unavailable.
4. Separate cold discharge from cold charge
At −20°C and 1C, #2 reportedly delivered 4904.4 mAh with midpoint voltage 3.4378 V and 93.66% retention. The exact room-temperature reference is not clearly identified; retain the percentage as reported instead of assigning a denominator from another test. Capacity retention does not establish equal energy or power retention when voltage also falls.
A separate −20°C, 1C charging record lists 4443.6 mAh, reported retention 84.99% and constant-current fraction 4.87%. Charge input is not subsequently deliverable discharge capacity, nor approval for general cold charging. Low-temperature charging can involve lithium plating. These are historical observations; permissible temperature and current must follow the exact cell specification and qualified laboratory validation.
5. Do not extrapolate 125 cycles into full life
After 125 cycles described at 3C, #1 reportedly retained 98.14% capacity with constant-current fraction 86.65%. The report incompletely defines whether charge and discharge were both 3C, CV termination, temperature, rests and capacity checks. This describes that stage of that sample only; it does not establish 500 or 1000 cycles or a calendar lifetime.
Track energy, resistance, thickness, temperature and abnormal events alongside capacity, with an agreed end-of-life criterion. Small capacity loss does not exclude other failure modes.
6. Include the nail-test failure in the conclusion
After cycling, #1 was reportedly fully charged at 1C before nail penetration. Fire, heavy smoke and a peak temperature of 396°C were recorded. Favorable rate capacity or early cycling retention cannot cancel this adverse abuse-test observation.
Nail size, speed, position, restraint, sensor location and standard are not fully disclosed, so a compliance pass/fail cannot be assigned. This is a destructive laboratory test, not a consumer procedure.
Photograph of the sample after the reported nail-penetration test, associated with fire, smoke and 396°C.
7. Separate structural observations from chemical identification
Disassembly of #2 reportedly found 49 positive and 50 negative sheets. Listed thicknesses are positive 78 μm, negative 74 μm, aluminium foil 20 μm, copper foil 12 μm and separator 20 μm. Inclusion of current collector and definitions of loading are unclear; do not compare ambiguous areal-loading values or infer rate-performance causality from these numbers alone.
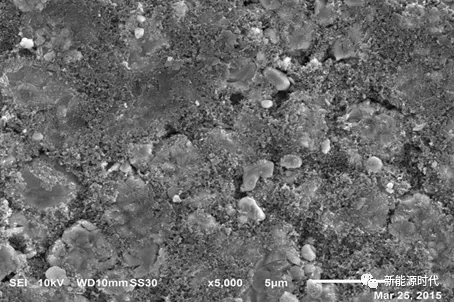
Cathode SEM shows particle morphology; C, Co and O signals in EDS support discussion of a cobalt-containing cathode, not a unique crystal phase or complete recipe. The report identifies LiCoO2; stronger identification needs XRD, composition and sample context. Conventional windowed EDS has limitations for direct lithium detection, while modern windowless systems differ. One SEM image also cannot chemically identify SEI or lithium oxides.
Cathode SEM micrograph with scale and instrument text; morphology alone does not identify chemistry.
EDS spectrum and table; elemental signals do not identify a unique compound or crystal phase.
8. Make the report reproducible
Add model and lot, sample allocation, the C-rate reference, SOC, ambient and cell temperatures, rests, pressure, cutoffs, charge termination, calibration and raw V/I/T. Every retention ratio should identify numerator and denominator; every life conclusion needs its cycle protocol.
This case illustrates complementary measurements and the limits of drawing conclusions from a small sample. The available results show why capacity, cold performance, cycling and safety observations should be assessed together, with each conclusion tied to its test conditions and evidence. The two-cell sample, ratio discrepancy, nail-test outcome and uncertainty in chemical identification all limit what can be inferred about other cells or products.
Procurement & Engineering Solutions
Related Battery Categories & Manufacturing Capacities
Looking to evaluate specifications or request custom engineering samples? Explore our verified product lines below: